Next week Tim Peake is going to the international space station. This is an important moment in UK space. The UK space agency has organised a whole raft of school activities, events, resources and so on to coincide with his mission. One of these is the Space to Earth Challenge. The essential idea here is that pupils will find wacky and amusing ways to travel the distance that Tim will travel in returning to Earth and track their progress in doing this. I was commissioned by the project and HP to write a set of maths activities to develop the mathematical thinking involved in the parallel science and PE activities that had been developed.
The activities were formally launched in a committee room just of the old Westminster Hall in the houses of parliament yesterday. Maths was well represented with an activity called ‘Fitness Tracking’ which uses HP Prime’s 2-variable statistics App to compare a target improvement rate with the unfolding actual improvement rate as someone works through a fitness programme. This is a general purpose piece of maths that works great for any fitness programme, so pupils can choose what it is they want to develop, decide on a measure for it and a timescale.
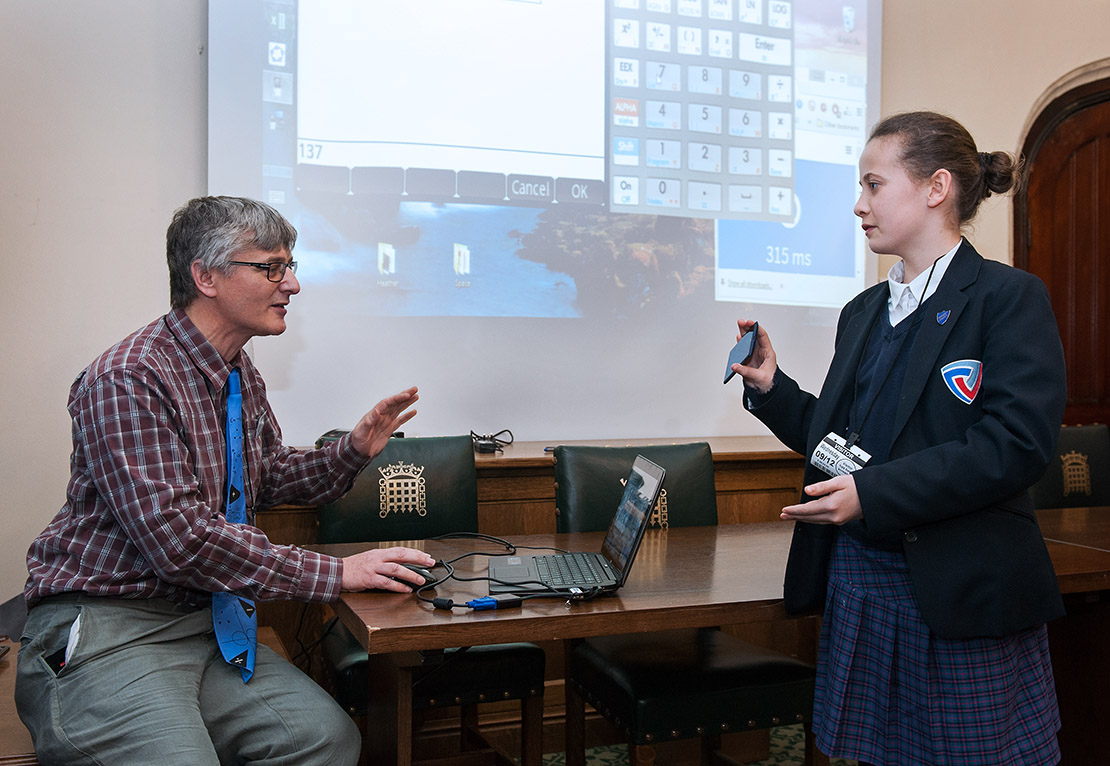
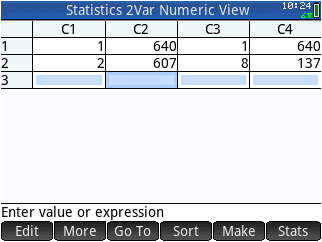
Take a benchmark measure to get started and decide on their target at the end. I had about 5 minutes, so with my trial subject (a year 6 pupil who just did fantastically … such confidence!) we saw the improvement in her reaction time on a web based timer on my phone. The leader board on the App said 137ms was attainable and my subject started at 640ms, so we had a benchmark and a target for which we gave 8 attempts. You see me entering the target into the HP Prime emulator in the background. She got off to a good start, improving by about 30ms per go, but then the pressure (and possibly the phone) got too much and the improvements disappeared!
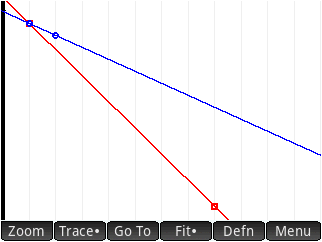
However, I think the set up makes very clear how a linear model can be used to generate a target improvement rate (in red) to compare against a linear model tracking the actual improvement (in blue) and so the maths worked really nicely.
This was for principally primary school pupils and the general public (plus MPs and space people!) However, I think we were all ready to talk about (linear) regression by finding the improvement rate in the fit equation, and then of course we would critique the linearity of the model;, … But the time ran out and that was saved for another day! However, in a lower secondary class, this is exactly what you would be able to do. There is a presentation, a teacher pack and a student sheet to support this in schools. Let me know how you get on.