Not so long ago I had a very minor Twitter spat with a former student of mine in which I advanced the view that knowing the Fibonnaci sequence was more useful than instant recall of 11×12. I was shot down, with the suggestion that I didn’t care about working class kids. Well, I guess, I would like to claim that I care about all kids, regardless. And, it seems that being able to read and understand mathematical information has suddenly become a whole lot more important than previously. Oddly enough, memorising specific number combinations has not proved to be of any great importance in this. Nor, to be fair has the Fibonnaci sequence cropped up. But, of course making sense of patterns and relationships absolutely has. We now live in a world in which it is expected that we can look at a graph with a logarithmic scale and read it sensibly. Also, we are being told (as I write) that the rate of increase in case numbers is decreasing. From this we need to know if the case numbers are going up or down and thus, what is in fact decreasing.
In school mathematics, the myth of application is ever present. Mathematics solves problems in the real world we are told. Except that we start from a curriculum containing specified mathematics, that must be taught, generally in a given order.  So, of course, the real world is bent and twisted to fit the mathematics that needs to be learned. In our teaching of distance and time, how often does a car travel at a uniform speed, showing a straight line on a distance time graph starting at the origin? (Instantaneous acceleration is a useful phenomenon in maths lessons, but nowhere else). The pandemic has not thrown up many linear models, or even quadratic models. Learning the maths presented in a distorted and damaged context is worse than unhelpful. Either the learner knows enough about how the real world works to recognise that the maths lesson version is simply not real and therefore the maths is not a model of it, or worse they build their knowledge of the world through this damaged notion that cars really do travel with contant speed, starting from rest. So, when stuff actually matters, as it really does in this pandemic, learners of school mathematics do not have the tools (they were not allowed to play with functions, instead they had to learn linear, then quadratic and never quite reached exponential) and would therefore expect reality to be required to fit.
 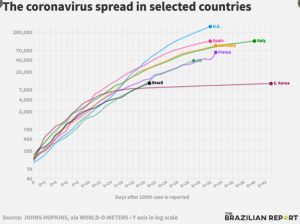 So, the growth rate graphs with the exponential scales, that then look much more linear, show the death rates in the USA only ever so slightly higher than those in Germany. This can only be because that is the way it was.
If we are to claim that maths has some use value and relavence to the word outside the maths classroom (as this year it really has like never before), then we need to engage our students in sense making. Looking at live data and playing with the maths to see how and where it might fit. With graphing software it is no harder to draw an exponential than a linear function and when it is driven by data that the learner has some investment in, then they will want to know. Building relationships between a felt and experienced world and mathematical objects useful for representing it, is complicated and muti faceted, but possible if we allow the setting to lead the maths rather than the other way round. I still have some ultrasound distance sensors which we would use connected to real time graph drawing software. Students would walk on a straight line towards and away from the sensor to create different distance time (and later velocity/time) graphs. In this way the relationship is created and really felt. The motion to create a sine curve as a distance/time graph is a very lovely thing. Equally our Pizza project had students find models for the cooling of a pizza from short term data (it looks very linear over the course of a 10 minute experiment, but what does that say about what will happen in the medium to longer term?) The implications of a model can only be engaged with in a context which behaves as the real world actually does.
I picked the Fibonnaci sequence as an example of interesting variation. 11×12 is not interesting, nor is it useful (except, I did find this example). To make sense of a world that behaves as the one our students actual live in does, they need to see what they learn as a examples from a range of useful tools that can, when critically applied, give us ways of seeing what happens in that world in a more manageable way. Linear and quadratic are examples of functions, of which there are many, many more. Times tables are number relationships of some power and Fibonannaci, Square, Triangle numbers also. So, when we see variation and relationship we take a flexible, open and always critical view of it.